The Demand curve doesn’t always remain in the same position. It may change when there is a change in any of its underlying determinants or factors. The determinants of Demand are:
-- 1. Price of own Good (Px)
2. Income of the Consumer (Y)
3. Price of the Related Good (Substitute or Complementary)(Pr)
4. Tastes and Preferences of the Consumer (T)
5. Future expectations about the price of the good.(E)
When any of its factors undergoes a change, the demand changes and so does the demand curve.
Movement in the Demand Curve
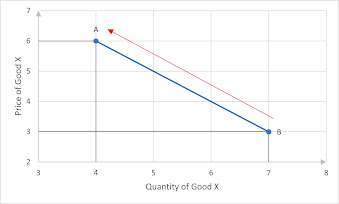
A demand curve shows the quantity bought at different level of prices, where quantity is shown on the X-axis and price on the Y-axis, and other factors are assumed to be fixed.
So, when there is a fall in own price of the good, the quantity demanded
increases. This is shown by a movement from a point A
to point B on the demand curve. The movement from a point A to B in case of fall in own price is also known as extension in demand.
Similarly, when the price rises, there is a fall in quantity demanded from a point B to A, along the same demand curve. This is shown by moving up the demand curve. The movement from a point B to A in case of rise in own price is also known as contraction in demand.
Shift in the Demand Curve
The quantity demanded may also undergo a change when the price of the good remains the same, but there is a change in other factors like price of related good, income of the consumer, taste and preferences of the consumer and future expectations about the price.
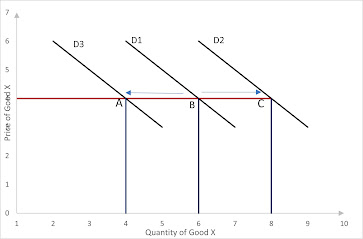
When there is a change in these other factors (own price remaining the same) the quantity demanded also changes and is depicted by a shift in the demand curve. The shifts can be forward (towards right) as well as backward (towards left) depending upon how these other factors have changed.
A forward shift is shown from a point B to C, where the demand curve shifts from D1 to D2.
A forward or rightward shift in demand curve is referred to as an increase in demand whereas a backward or leftward shift in demand curve is referred to as a decrease in demand.
|
Factors causing
an increase in demand
|
Factors Causing
a decrease in demand
|
|
Increase in
income of the consumer |
Increase in
income of the consumer |
|
Increase in
price of the substitute good |
Decrease in
price of the substitute good |
|
Decrease in
price of complementary good |
Increase in
Price of complementary good |
Favorable taste
and preferences for a good |
Unfavorable taste and preferences for a good |
|
Expectation of a
rise in price in near future |
Expectation of a
fall in price in near future. |
Factors Causing Shift in Demand Curve
1.Income of the Consumer
Normally, an increase in income of the consumer means a rise in the resources in the hands of the consumer. Therefore, with the price remaining the same, a rise in income of the consumer leads to an increase in demand. Thus, shifting the demand curve towards right from D1 to D2. With a fall in income of the consumer, the demand falls, shifting it towards left from D1 to D3.
The goods for which the demand increases with an increase in income and demand decreases with a fall in income are called normal goods.
However, all goods are not normal goods. There may be cases where the good is an inferior good. There are certain types goods which a consumer may value as inferior compared to other goods. With such goods, with a rise in income, people would want to shift to a better or superior good. For example, a consumer would buy a car instead of a bike when his/her income increases. Hence, a bike is an inferior good for the consumer.
Therefore, with a rise in income of the consumer, the demand for the
inferior good falls from D1 to D2. With a fall in income of the consumer, the consumer is
forced to continue consuming the inferior good, hence its demand increases from D1 to D3.
Substitute goods
Substitutes goods are those goods which can be used in
pace of one another in the sense that they satisfy the same want of the
consumer. Like tea and coffee, apples and oranges.
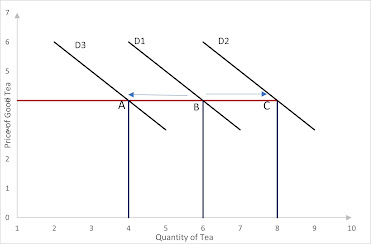
So, the change in the price of coffee has an impact on the demand for Tea. If the price of coffee increases and becomes more than tea, a rational consumer would want to buy more of tea instead of coffee as tea has now become relatively cheaper compared to coffee. In other words, the consumer would want to replace coffee with tea. Therefore, as the price of rises falls, the demand curve for tea shifts from D1 to D2 and the demand for tea increases.
Similarly, if the price of coffee falls and becomes less than tea, a rational consumer would want to replace tea with coffee, as coffee is now cheaper compared to tea. Therefore, as the price of coffee falls, the demand curve for tea shifts from D1 to D3 and the demand for tea decreases.
As the price of substitute good rises, the demand for the other good rises. As the price of substitute good falls, the demand for the other good falls.
Complementary Goods
Complementary goods are used along each other. So, a rise in price of one good leads to a fall in demand of the other good. As the price of the complementary good falls, the demand of the other good rises. Taking the example of car and petrol, if the price of petrol falls, the demand curve for cars shifts forward from D1 to D3 showing an increase in demand for cars. If the price of petrol rises, the demand curve shifts backwards from D1 to D3 showing a decrease in demand for cars.
As the price of complementary good rises, the demand for the other good falls, and when the price of complementary good falls, the demand for the other good rises.
Taste and preferences
Taste and preferences play a very important role in deciding what goods and services to the consumer will buy. When fashion or trends change, it influences the tastes and preferences of the consumers and the demand for those good changes with the own price remaining the same.
When a consumer develops a favorable taste for a good or service, he/she may demand more of that good even when there has been no change in the price of a good. In such a case, the demand curve shifts to right indicating an increase in demand.
On the other hand, when the consumer develops an unfavorable taste for a good or service, he/she may demand less of that good even when there has been no change in the price of a good. In such a case, the demand curve shifts to left indicating a decrease in demand.
Tastes and preferences depend upon the personal likes and dislikes of the consumer, a change in fashion or trends, or a change in climate or season.
Future Expectation Regarding Change in Prices
The quantity demanded of a good doesn’t only depend upon the current price of the good but also on the future price. Consumers form expectations regarding what the price of the good will be in the future. Based on this expectation, they decide the quantity bought of that good today.
If the consumers expect the price of a good to rise in future, he/she may want to buy that good today. Hence, demand of the good increases even with the price remaining the same (Demand curve shifts forward).On the other hand, when the consumer expects the price to fall in future, he/she may forgo buying now and wait for the prices to fall, thus decreasing the decreasing the demand for that good now (Demand curve shifts backward).
Key Points
- Movement in the demand curve occurs when the own price of the good changes while other factors influencing demand do not change.
- A movement in the demand curve is shown by a movement up or down the curve. A movement down the curve is called extension of demand and occurs when the price of the good falls. A movement up the curve is called contraction of demand and occurs when the price of the good rises.
- Shift in the demand curve occurs when any of the other factors influencing demand change while the price of the good doesn't change. These other factors are : Income of the consumer, price of related good, tastes and preference of the consumer, expectation regarding future change in price.
- A shift in the demand curve is shown by a shift forward or backward of the demand curve. A forward shift in the demand curve is called increase in demand. A backward shift in the demand curve is called decrease in demand.
|
|


