
Ordinal Utility Analysis

Unlike the Cardinal utility analysis, which measures utility by numbers, ordinal utility analysis compares utility across different goods and services. Under ordinal utility analysis, utility can't be measured in numbers but compared. So, instead of saying that an orange gives 6 utils and an apple gives 3 utils of utility, we say that an orange gives more utility to the consumer than an apple.

Ordinal utility analysis gives rise to the concept of indifference curve. 

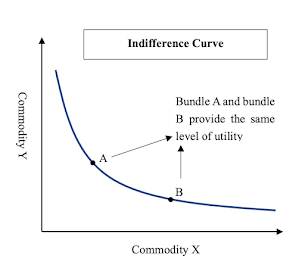
Indifference curve depicts the different combinations of two goods which gives the consumer the same level of satisfaction. 


Popular Posts

Understanding Trade-Offs in Economics: Balancing Choices for Optimal Outcomes

  TRADE-OFFS  Economics is concerned with people making decisions. However, these decisions are not always easy to make as making a decision involves making a choice. This choice may be between different alternatives/goals/options. Generally, choosing one goal means not being able to choose the other one. This results in what we call a trade-off where in order to choose one thing we have to let go or sacrifice the other one. Examples of Trade-Offs:  P eople face numerous trade-offs in their daily lives. Let’s say a person wants to reach his office. He may either go by car or bicycle. Going by a bicycle is not only environmentally friendly but also is a good exercise. However, going by a car will save time and make him reach faster. This is a situation of trade-off where the person has to choose an option and in choosing one, he will be giving up the other one. A family which has a limited monthly budget has to decide whether to spend that money on a vacation, saving for their chil

Measures of Central Tendency

Let’s say I walk into a class of fifth graders, and start asking them their ages one by one and note them down. There are 20 students in the class and this is what my list looks like Roll. No.               Age 1.                           10 2.                           10 3.                           10 4.                            9 5.                           10 6.                            10 7.                            9 8.                            11 9.                            10 10.                          10 11.                          12 12.                          10 13.                           9 14.                          10 15.                          10 16.                          11 17.                          10 18.                           10 19.                            9 20.                           10 As I look at their ages, do I see something common or worth noting. More specifically do I find a n

Consumer's Equilibrium using Marginal Utility Analysis

The Law of Diminishing Marginal Utility It has been observed that the desire to consume a commodity decreases as more and more units of that commodity are consumed. Therefore, every successive unit of the commodity consumed provides lesser utility than before. The Law of Diminishing Marginal Utility states that as more and more units of a commodity are consumed, the Marginal Utility derived from every successive unit of the commodity declines.  This happens because psychologically, as a consumer starts to consume one unit of the good after another, the the consumers satisfaction reaches a saturation point. So, with every successive unit consumed, the additional utility the consumer derives goes on declining.  Consumer's Equilibrium using Marginal Utility: Cardinal Analysis Consumer's equilibrium is that level of consumption at which the consumer is getting maximum satisfaction (benefit) while spending out of his given income across different goods and services, and has no tende